Singapore · NEA's hourly reading, by area
Your air, right now.
Both are from NEA: the PSI averages 24 hours, PM2.5 shows the last hour.
HazeNow puts NEA's last-hour reading first, with NEA's advice in plain words, so you can decide what to do right now. The 24-hr PSI stays alongside, for planning tomorrow.
- Data: NEA via data.gov.sg
- Free & open source (MIT)
- No ads, no tracking, no account
NEA's latest reading
Getting NEA's latest reading…
For you, generally healthy. Advice for kids, older adults and more in the app.
How it looks
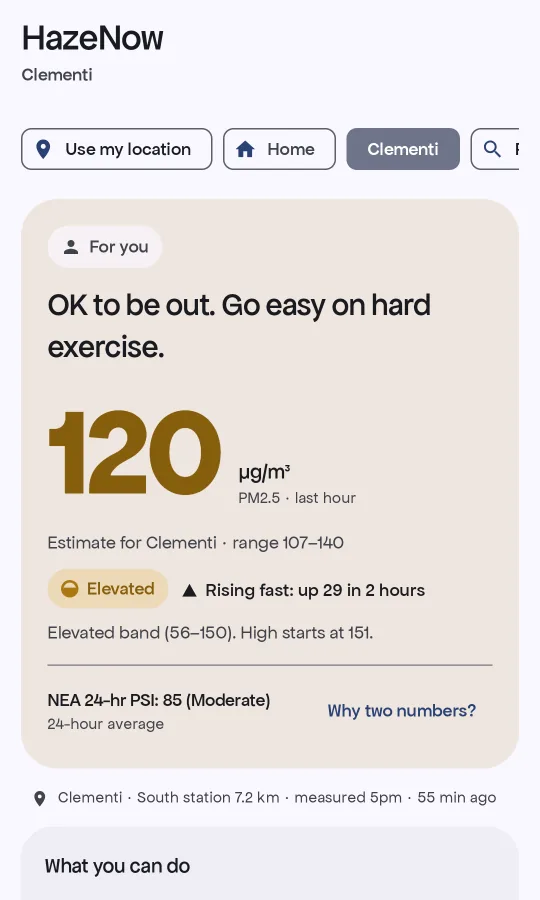
The verdict first. The number second.
Every HazeNow screen follows the same order: plain advice, NEA's 1-hr PM2.5 and band, where it was measured, then NEA's 24-hr PSI. People act on a sentence, not on a number alone.
$ npx hazenow --oneline
…
$ npx hazenow --json | jq -r .band
…
- Where it was measured, on the main screen. Station, distance and how long ago.
- Honest ranges. When your spot is between stations, we show what nearby stations read.
- Calm by design. NEA's band names and colours, a shape for every band, no alarm red for Elevated.
Get it everywhere
One number, wherever you look.
Every version uses the same rules and the same words, so the answer matches on your phone, your desk and your home. Nothing is on an app store yet, so you won't see store badges here. "Available" means you can install it today.
Live Available Beta Coming soon
-
Live
Web
The full HazeNow in any browser: verdict, 24-hour chart, your area, share cards. Add it to your home screen.
-
Available
iPhone
Add the web app to your Home Screen from Safari today, or add the Scriptable widget. The native app, with a Live Activity and Apple Watch, comes later.
-
Beta
Mac menu bar and notch
● 105 ▲ in your menu bar, with an optional pill by the notch.
-
Beta
Android
Widgets, a Quick Settings tile and rare, calm band alerts. Updates through Obtainium if you like.
-
Available
Command line
hazenow,--watch,--json, tmux and starship. Onenpm i -gfrom our releases. -
Coming soon
Raycast
The reading in your menu bar, plus every area in one list. Store submission next.
-
Available
Home Assistant
Sensors for PM2.5, band, verdict and NEA's 24-hr PSI. Install as a HACS custom repository.
-
Coming soon
Telegram bot
/nowfor your area, and band-change alerts that always send the all-clear. -
Available
Scriptable iPhone widget
A home and lock-screen widget today, with no App Store wait. Paste one script into the free Scriptable app.
-
Available
SwiftBar and xbar
The zero-build Mac option: one Python file, standard library only.
-
Available
tmux and starship
A status-line reading for your prompt. Needs only
curlandjq.
Why two numbers?
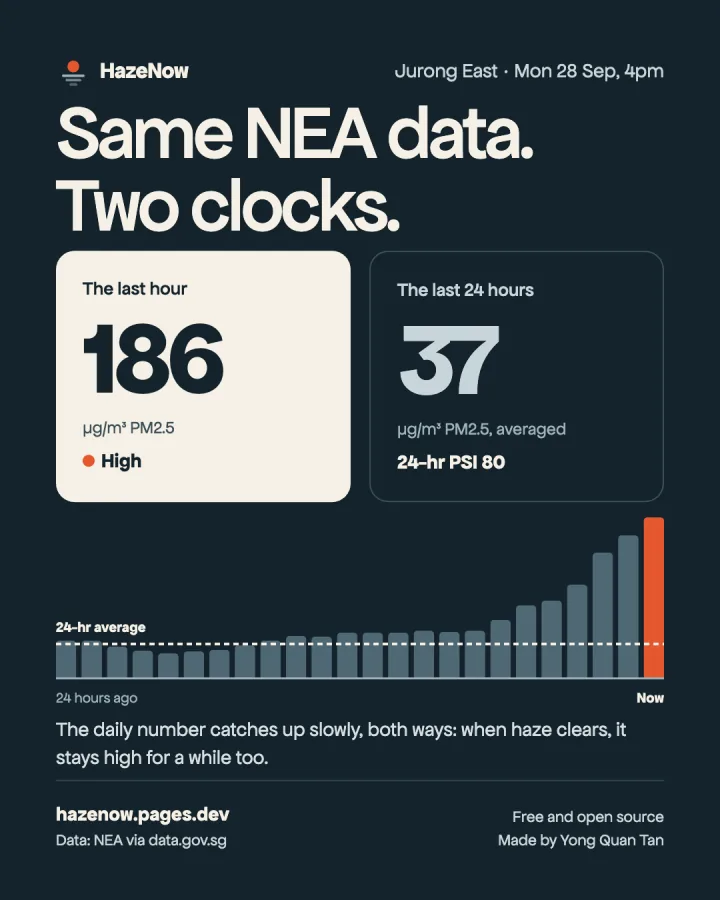
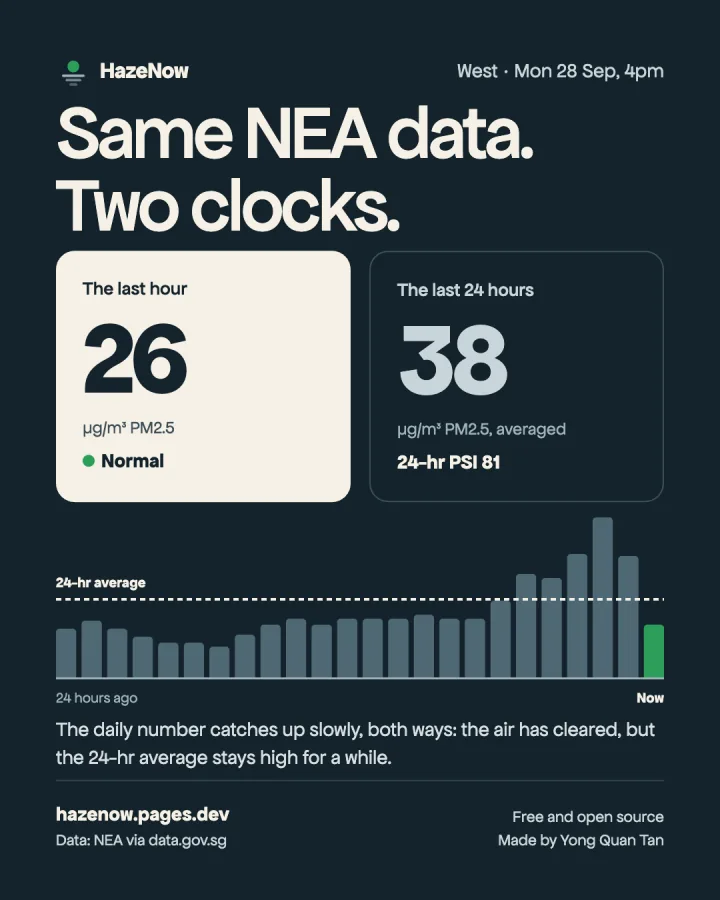
Same NEA data. Two clocks.
NEA's 24-hr PSI is an average of the last 24 hours, so it changes slowly and is best for planning tomorrow. The 1-hr PM2.5 shows the last hour, and NEA recommends it for deciding what to do right now.
The chart shows it instead of saying it: hourly bars for the 1-hr PM2.5, and NEA's own 24-hour average as a line, both in µg/m³. No invented index.
- For right now
- NEA's 1-hr PM2.5 and its band.
- For planning tomorrow
- NEA's 24-hr PSI forecast. Schools and events plan with it.
Built to be shared
Made for the group chat.
Haze news travels through family, class and running chats. One tap picks the right card. Each one prints the date, time, area and "Data: NEA via data.gov.sg", so a forwarded image stays honest.
-
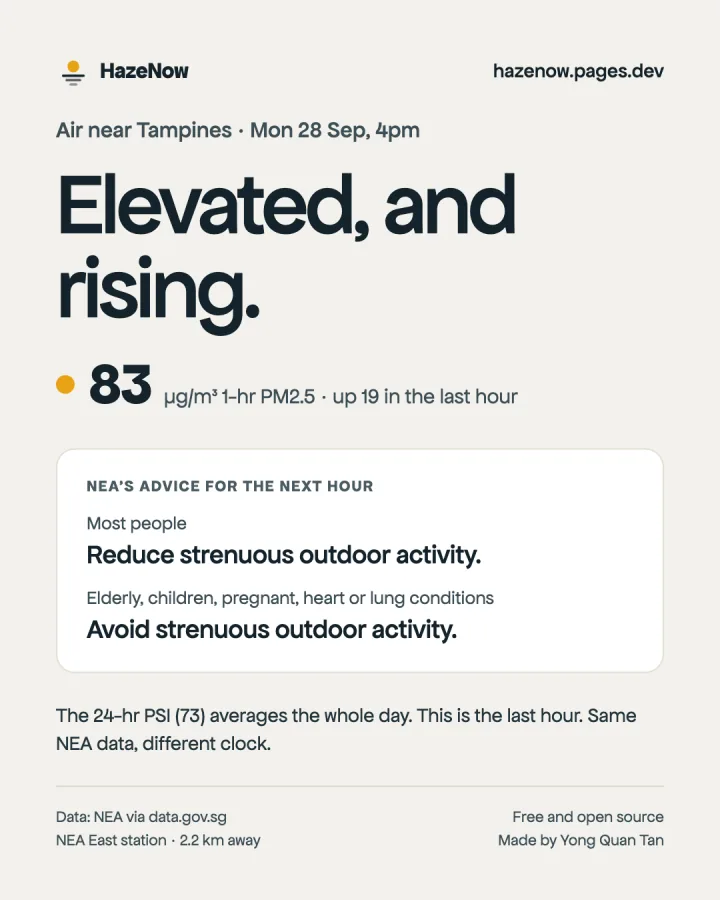
Now
For family and neighbourhood chats: NEA's own advice for most people and for vulnerable groups.
-
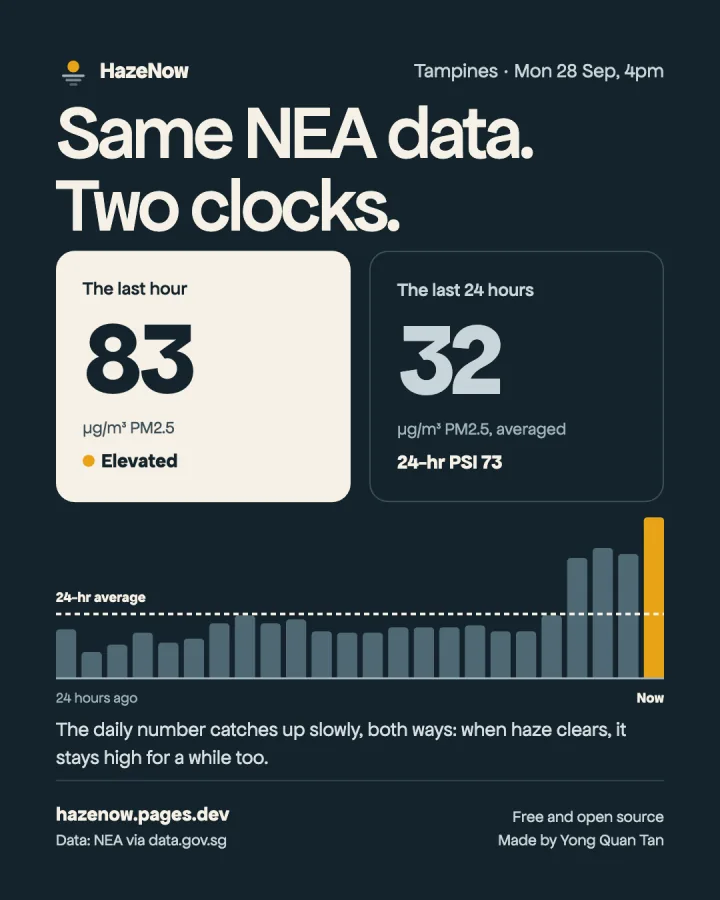
Two clocks
For anyone asking why the numbers differ. The chart explains it without taking sides.
-
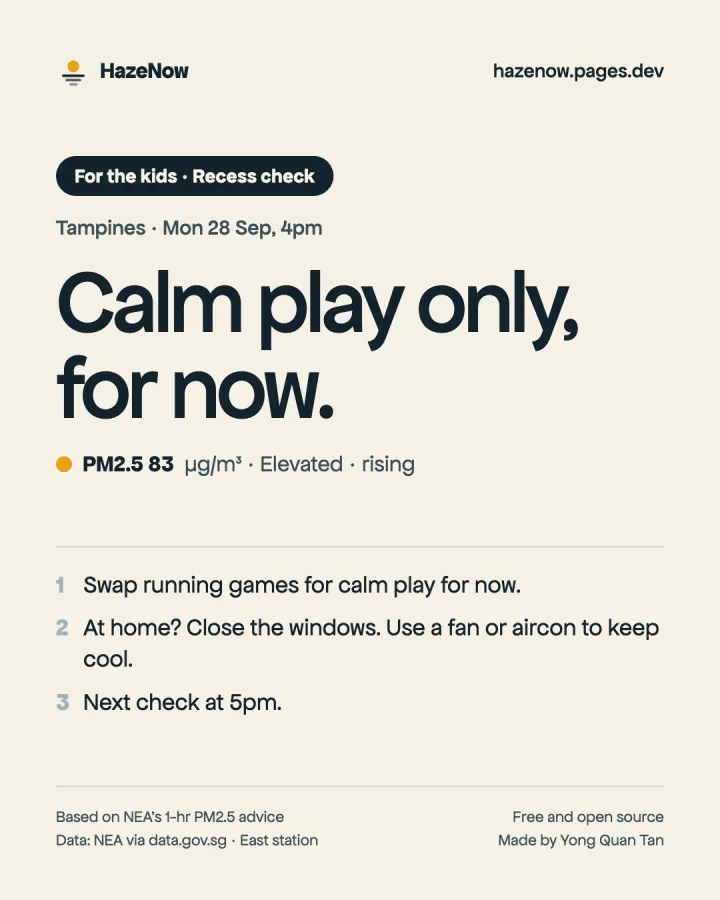
For our group
For a parent group, a run club or a caregiver chat. Advice for one group, said plainly.
-
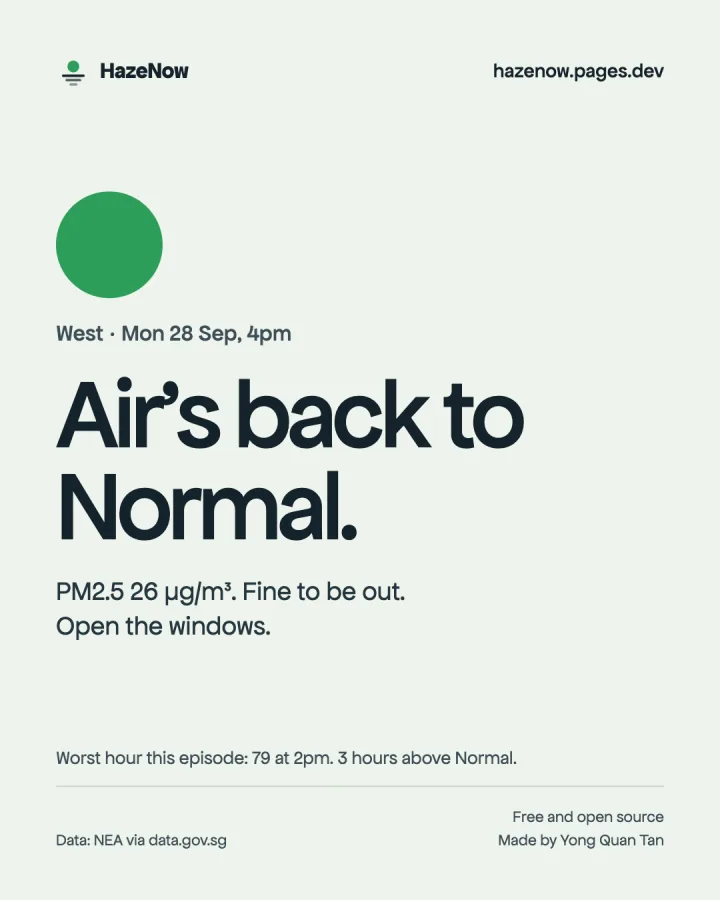
All clear
For the same chats, when the air is back to Normal. Relief is worth sharing too.
Why open source
A health tool you can check.
Trust is the whole point of HazeNow, so everything it does is public.
Free, for good
No price, no premium tier, no "pro" features held back during a haze.
No ads, no tracking, no account
No analytics, no sign-up, nothing sold. Profiles are saved on your device only.
Your location stays on your phone
We use it only to pick the nearest NEA stations, on the device. It's never sent anywhere.
Official data, credited
In Singapore, every number is NEA's, via data.gov.sg. Elsewhere, each country's own authority. We don't change readings or invent an index.
Audit every line
MIT licensed. The maths, the wording and the advice rules are all in the repository.
One set of rules, every app
Web, phone, Mac and integrations share one written spec and test cases, so they agree.
Southeast Asia
The same calm answer, across the region.
Each place uses its own authority's numbers and its own band words. Thailand is live on the web. Other countries are built and tested on recorded data, and go live once our data server is up and each authority agrees.
Haze has two seasons here: the southern one from Jul to Oct, and the northern one from Jan to Apr. HazeNow is built to be ready for both.
Updates
What's new.
Share cards
Now, Two clocks, For our group and All clear. The web app picks the right one in one tap; the Android and Apple apps have them too.
Pick your area, offline
All 55 planning areas, searchable on the device, so typing your area sends nothing anywhere.
Fresher readings
HazeNow now checks for NEA's new hourly reading from just after the hour, when NEA posts it, instead of waiting half an hour.
About HazeNow
I built HazeNow because the number most of us check during a haze, the 24-hr PSI, moves slowly. NEA also publishes the last hour's PM2.5, and recommends it for deciding what to do right now. HazeNow puts that number first, in plain words, using only NEA's data.
It's free and open source (MIT). No ads, no tracking, no account. Your location stays on your phone.
— Yong Quan Tan
- Kairos Labs · kairoslabs.sgI run Kairos Labs, an applied AI studio.
- Source code on GitHub